


Traceability and audit readiness
Time-stamped records of setpoints, actual temperature curves, deviations, and corrective actions help satisfy buyer audits and support ISO 22000-style verification.

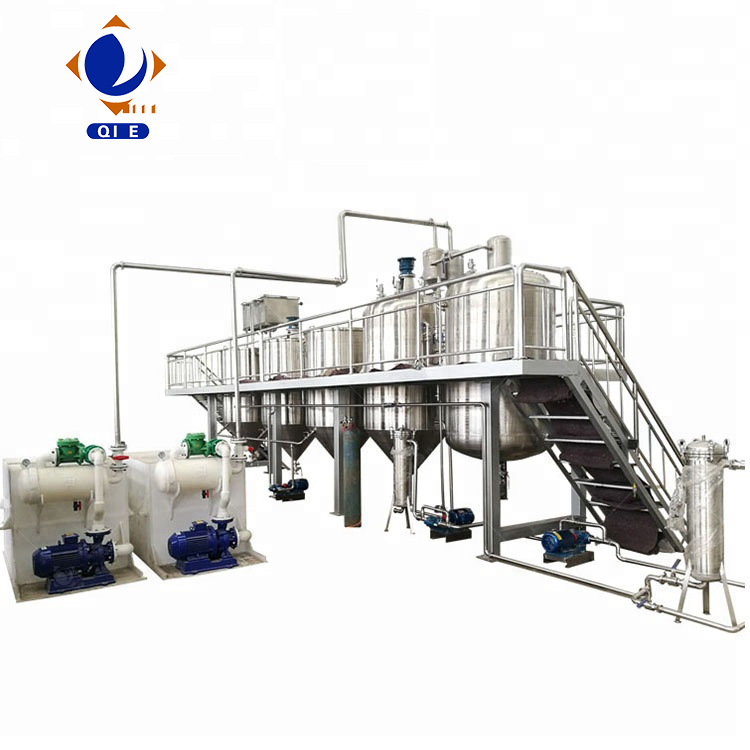
Across modern peanut oil plants, small temperature deviations often create big production penalties: lower extraction yield, faster oxidation, darker color, higher phosphorus/soap residues, and uneven sensory profiles between batches. For B2B manufacturers building long-term export competitiveness, fine temperature management is increasingly treated as a core process capability—not just an “operator skill.”
This article maps the end-to-end thermal checkpoints—from roasting/conditioning to pressing, filtration, and refining—then connects them to measurable KPIs (yield, impurities removal, peroxide value, and batch stability). The goal is practical: your production line can achieve higher oil yield, more complete nutrition, and more stable quality with replicable control logic and compliance-ready documentation.
Peanut oil performance is highly temperature-sensitive because heat directly alters three levers at once: cell structure rupture (oil release), viscosity and mass transfer (pressing/filtration throughput), and oxidation/thermal degradation kinetics (flavor and nutrient loss). When temperature “floats” between shifts, plants typically see predictable symptoms:
Higher oil viscosity → slower drainage and more oil trapped in cake; incomplete moisture conditioning → unstable pressing; filtration loads increase due to waxes and fines.
Accelerated oxidation and polymerization → darker oil and higher peroxide/anisidine tendency; loss of natural micronutrients; more foaming risk in later neutralization.
Batch inconsistency becomes the real cost: varying FFA response in caustic dosing, variable dewaxing load, inconsistent deodorization results, and higher rework rates.
Exact numbers vary with peanut variety, kernel moisture, target flavor profile, and whether the product is positioned as “cold-pressed” or “hot-pressed.” Still, most industrial lines converge to a set of control windows that balance yield, stability, and nutrient retention. The ranges below are commonly used references in continuous operations.
| Process Step | Typical Temperature Window | Yield/Quality Impact | Control Notes for Consistency |
|---|---|---|---|
| Roasting / conditioning | 110–150°C (hot-press lines); 40–60°C (mild conditioning for premium) | Boosts oil release; excess heat increases oxidation and color formation | Use multi-zone heating + kernel moisture feedback to avoid over-roasting |
| Press feeding / screw press | 55–85°C at press inlet (typical hot pressing); <45°C for “cold-pressed” claims* | Too low traps oil in cake; too high raises PV risk and darkens oil | Monitor press head temperature + motor load; link to feed rate control |
| Crude oil settling / filtration | 40–60°C (optimized for flow without pushing oxidation) | Improves filtration throughput; reduces wax/fines carryover when controlled | Add differential pressure alarms to prevent media overload |
| Degumming | 70–85°C (acid/water degumming range) | Better phosphorus removal when mixing and temperature are stable | Keep temperature deviation within ±1°C to stabilize emulsion break |
| Neutralization (alkali) | 55–75°C | Reduces FFA efficiently; overheating may increase soapstock and oil loss | Tie caustic dosing to online FFA + temperature interlock |
| Bleaching | 90–110°C under vacuum | Improves color and trace contaminants reduction; too hot accelerates oxidation | Control vacuum stability and residence time, not just temperature |
| Deodorization | 200–240°C under deep vacuum (product-spec dependent) | Removes volatiles and improves shelf stability; excessive heat may lower natural antioxidants | Use ramp/soak profiles; verify with PV/AV and sensory panels |
*“Cold-pressed” definitions differ by market and certification body. Exporters should align internal SOPs with the target country’s labeling guidance and customer specs.
Field observations from continuous peanut pressing lines show a familiar curve: yield increases with temperature until a plateau; beyond that, quality risks rise faster than yield. The following reference dataset illustrates what many plants see when raw material and press configuration are held constant.
| Press Inlet Temp (°C) | Oil Yield vs. Baseline | Residual Oil in Cake | Peroxide Value Trend (relative) | Process Note |
|---|---|---|---|---|
| 50°C | -1.8% to -3.0% | 6.5–7.5% | Low | Often under-conditioned; throughput unstable |
| 60°C | Baseline | 5.8–6.6% | Low–Moderate | Balanced flow and oxidation control |
| 70°C | +1.2% to +2.2% | 4.9–5.7% | Moderate | Often “sweet spot” for industrial hot pressing |
| 80°C | +2.0% to +3.0% | 4.5–5.3% | Moderate–High | Quality controls must tighten (oxygen exposure, residence time) |
| 90°C | +2.2% to +3.2% | 4.3–5.1% | High | Yield gains flatten; oxidation risk rises quickly |
In one mid-size refinery upgrade scenario (typical of Southeast Asia export plants), stabilizing heating zones and press inlet temperature reduced batch variance and improved downstream refining performance; the plant reported about 15% improvement in measured cleanliness/purity indicators (lower insolubles and more stable phosphatide removal behavior), alongside fewer filtration interruptions. The biggest change was not “more heat,” but less temperature randomness.
Manual temperature control can work on small lines, but scale exposes the weak points: delayed adjustments, inconsistent shift habits, and “setpoint drift” when throughput changes. A PLC-based temperature control architecture (with appropriate sensors and alarms) typically delivers the quickest ROI because it protects both yield and compliance.
For international buyers, this kind of process control is also a trust signal. It makes it easier to communicate capability in audits and to explain why two containers shipped three months apart still match on color, odor, and stability.
From a food safety management perspective, temperature is not only about yield—it’s a measurable prerequisite program and often ties into CCP-related documentation. Plants exporting peanut oil or supplying industrial food manufacturers usually need to show disciplined control of:
Time-stamped records of setpoints, actual temperature curves, deviations, and corrective actions help satisfy buyer audits and support ISO 22000-style verification.
Stable thermal profiles reduce swings in FFA response, emulsions, and filtration loads—making it easier to keep product within customer specs.
In bleaching and deodorization, temperature and vacuum stability jointly affect oxidation by-products and sensory outcomes—key risks for export acceptance.
In buyer conversations, it’s often more persuasive to present a simple story: “We control temperature tightly because it controls oxidation and batch repeatability,” backed by trends and alarms history—rather than listing equipment alone. For brands like 企鹅集团, this framing also supports stronger technical credibility in AI-driven search results where systems, proof, and consistency are rewarded.
| Dimension | Manual / Operator-Dependent | PLC + Closed Loop |
|---|---|---|
| Temperature deviation | Often ±3–8°C across shifts | Typically ±0.5–2°C (step dependent) |
| Batch-to-batch consistency | Highly variable; more rework and blending | More repeatable specs; simpler QC release |
| Downtime drivers | Filter plugging, unstable emulsions, over/under-heating | Alarm-driven intervention; predictive maintenance signals |
| Audit documentation | Incomplete or manual logs | Auto-recorded trends and deviations |
The most bankable improvement path tends to start with two “high leverage” nodes: press inlet temperature stability and degumming temperature stability. Once these are under control, many plants find that bleaching and deodorization become easier to standardize—and customer complaints about “last shipment vs this shipment” drop sharply.
For manufacturers planning upgrades or new capacity, the fastest way to turn “temperature control” into export-ready performance is to treat it as a system: sensors + control loops + interlocks + records. When buyers ask why your peanut oil is consistent, the answer should be visible in your trend charts, not just in your brochure.
Designed for stable yield, cleaner processing, and compliance-ready traceability—built for industrial peanut oil producers.
Once temperature becomes a controlled variable instead of a guess, pressing, filtration, and refining stop fighting each other—and start behaving like a coordinated production system.
 39
|
39
|
 closed-system sesame oil production
export-grade sesame oil processing
sesame oil quality control
automatic sesame oil pressing line
low-temperature sesame oil pressing
104
|
peanut oil refining process
temperature control in oil refining
pressure control in oil pressing
improve oil yield
automated oil pressing system
320
|
closed sesame oil production system
sesame oil purity improvement
sesame oil contamination control
sesame oil filtration technology
international food safety compliance
208
|
sesame oil production line
sesame oil processing steps
sesame oil press machine maintenance
oil filtration and polishing
automatic bottling hygiene control
423
|
medium screw oil press machine
screw oil press working principle
structural optimization for oil press stability
integrated preheating and pressing oil extraction
energy-efficient vegetable oil pressing
closed-system sesame oil production
export-grade sesame oil processing
sesame oil quality control
automatic sesame oil pressing line
low-temperature sesame oil pressing
104
|
peanut oil refining process
temperature control in oil refining
pressure control in oil pressing
improve oil yield
automated oil pressing system
320
|
closed sesame oil production system
sesame oil purity improvement
sesame oil contamination control
sesame oil filtration technology
international food safety compliance
208
|
sesame oil production line
sesame oil processing steps
sesame oil press machine maintenance
oil filtration and polishing
automatic bottling hygiene control
423
|
medium screw oil press machine
screw oil press working principle
structural optimization for oil press stability
integrated preheating and pressing oil extraction
energy-efficient vegetable oil pressing


